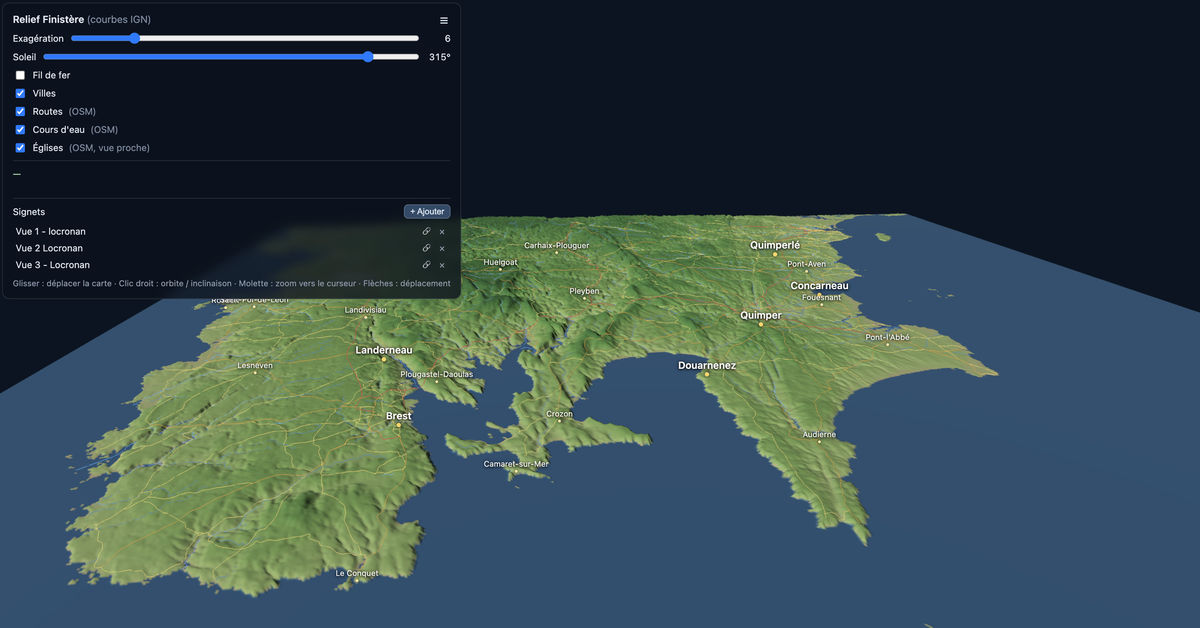
Using open data from IGN (french institute for geographical maps), I asked new Claude 5.0 to build a threejs powered landscape viewer. I downloaded data files from IGN (`.shp`/`.dbf` format) and let a custom processor convert to binary format as explained by Claude who did the job :
The format is deliberately minimal — a raw dump of a
Float32Array, with all the metadata moved out to a JSON sidecar. Two files inweb/data/:
heightmap.bin— 15.4 MB of nothing but altitudes. It’s a 1883 × 2049 grid (W × H) of IEEE-754 32-bit floats, little-endian, in meters above sea level. There is no header, no magic number, no compression: byte 0 is the start of the first float, and the file is exactlyW × H × 4bytes. The values are laid out row-major (whole first row, then the second…), and row 0 is the northernmost row, matching screen/texture convention so the viewer never has to flip anything. So the altitude of grid cell (colx, rowyfrom the north) lives at byte offset(y * 1883 + x) * 4, and in JS it’s just:const grid = new Float32Array(await (await fetch('data/heightmap.bin')).arrayBuffer()); const alt = grid[y * width + x]; // mètresThat’s the whole “parser” — which is the point. A typed array view over the fetched buffer costs zero decoding time, unlike the source
.shp/.dbfyou have selected, which need real parsing (record headers, ring offsets, DBF field descriptors…).
meta.json— everything needed to interpret those numbers geographically:
width,height— grid dimensions (1883 × 2049);cellSize— ground distance between adjacent samples, ~75.2 m;xmin/ymin/xmax/ymax— the bounding box in Lambert-93 meters (EPSG:2154), so cell (x, y) sits at eastingxmin + x*cellSize, northingymax − y*cellSize(minus, because row 0 is north);zmax(375 m) — used by the viewer to scale the color ramp;crsandsource— provenance.Semantics worth knowing:
- Sea is exactly
0— the flood-fill clamp wrote literal zeros, which is why the viewer can treatz ≤ 0.5as water.- Between contour lines the values are interpolated (the Laplace solve), so off-contour cells are smooth estimates, not measurements; on-contour cells average the contour altitudes that crossed them.
- No NoData value exists. Beyond the department boundary the grid holds extrapolated values rather than a sentinel — a known limitation noted in the README.
Trade-offs of the choice: Float32 is 4 bytes/cell where Uint16 decimeters would be 2 (≈ 7.7 MB), and PNG-16 would compress further — but both need decode steps and quantization, while this loads in one
fetch+ one constructor call and round-trips the solver’s output exactly. If load size ever matters (e.g. serving over slow networks), the easy win is gzip on the wire: smooth float rasters compress to roughly halfrelated projects : online mapping with threejs